

Overview
Magento 2 doesn’t support chart for most of reports. User must see data table and analysis data manually. Reports of magento 2 show data on screen, but without calculation or compare. There are a lot of questions when see basic reports, Advanced Reports Extension handles the data and visualize the statistic data, the easier way to understand.
Advanced Reports was combined by two popular chart technologies: nvd3 (based on D3) and Google chart. these frameworks was designed to achieve the best user experience. Colors and interaction effects help user focus on the main data.
Magento 2 gets data from statistics because this solution is good for website performance, so reports is not real time, to ensure that the data is latest, please refresh statistics
Compatible with Magento CE 2.1, 2.2, 2.3, 2.4
Demo version:
BackendCreate an account and get a discount 20% for first 5 purchases at X-MAGE2
Features
-
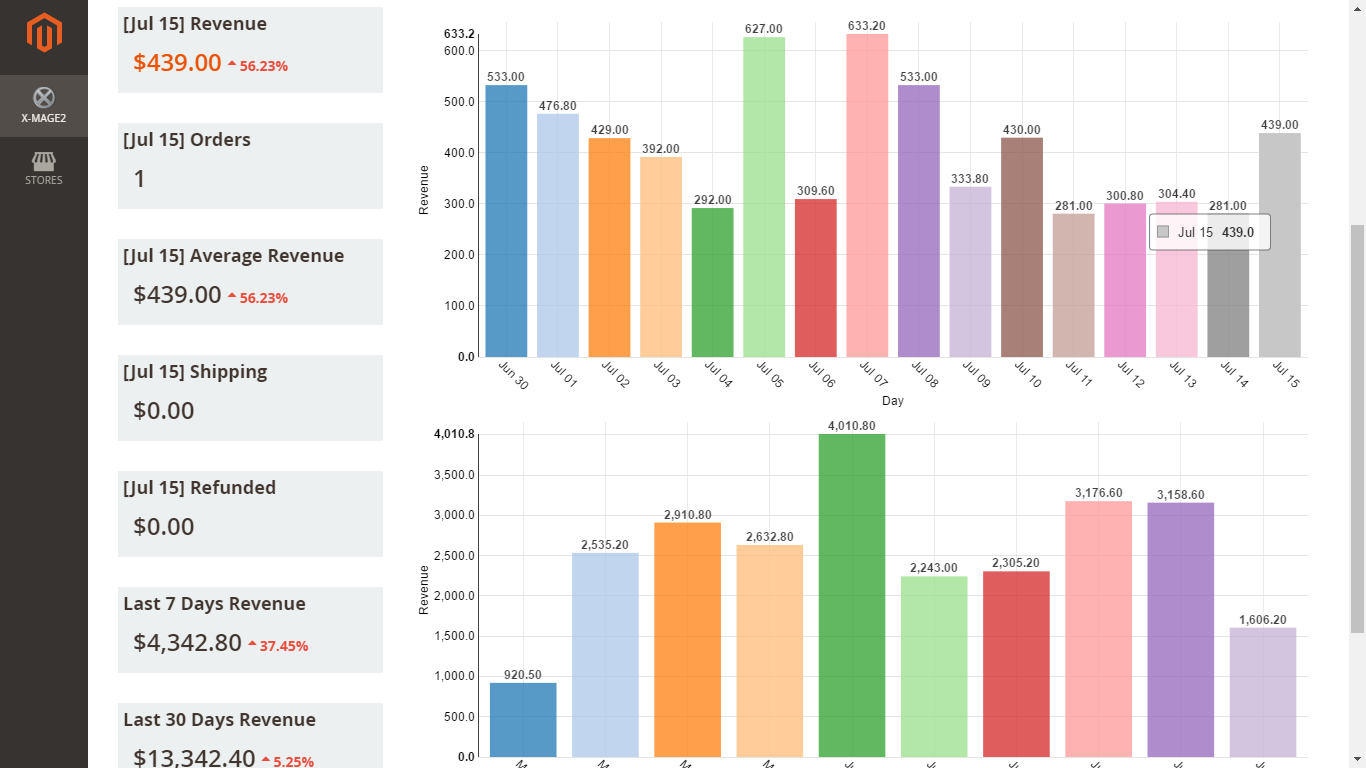
Revenue Report:
- Today Revenue: The system loads data from magento statistic database, then calculate correlation between today and yesterday revenue. This correlation is expressed by percentage.
- Today Orders, Today Avarage Revenue, Today Shipping, Today Refunded: Like today revenue repport, all results are calculated by statistic data. All of reports are compared to yesterday data.
- Last 7 days revenue: Show revenue of last 7 days, the result is compared to previous days (from 8th to 14th)
- Last 30 days revenue: Show revnenue of last 30 days, the result is compared to previous days (from 31st to 60th)
- Revenue by Days: Show revenue each day, number of days can change in configuration section.
- Revenue by last weeks: Show revenue each week, number of weeks can change in configuration section.
-
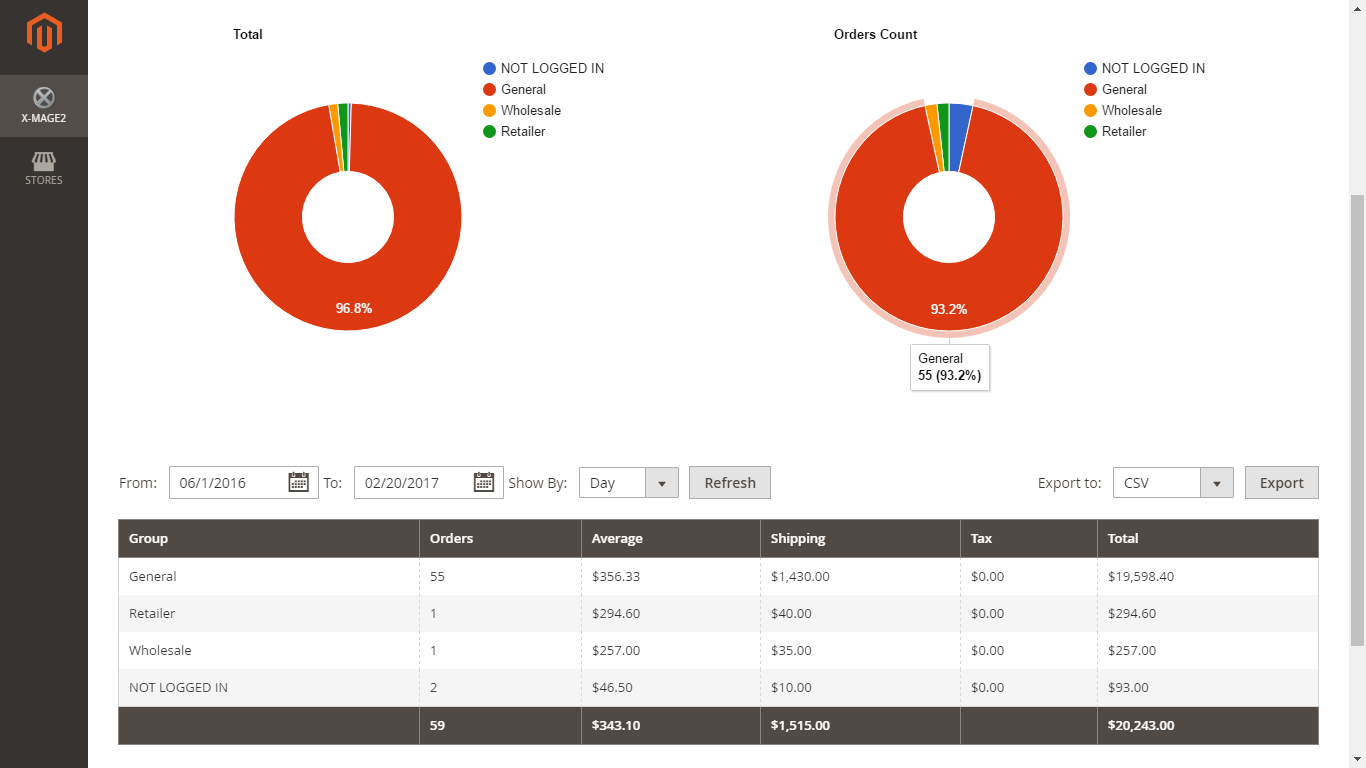
Customer Group Report:
Classifies customers based on group name. The data detail is displayed on data table, and percentage of each group will be calculated to show on chart. There are two charts with two purposes: [Total – Group] and
-
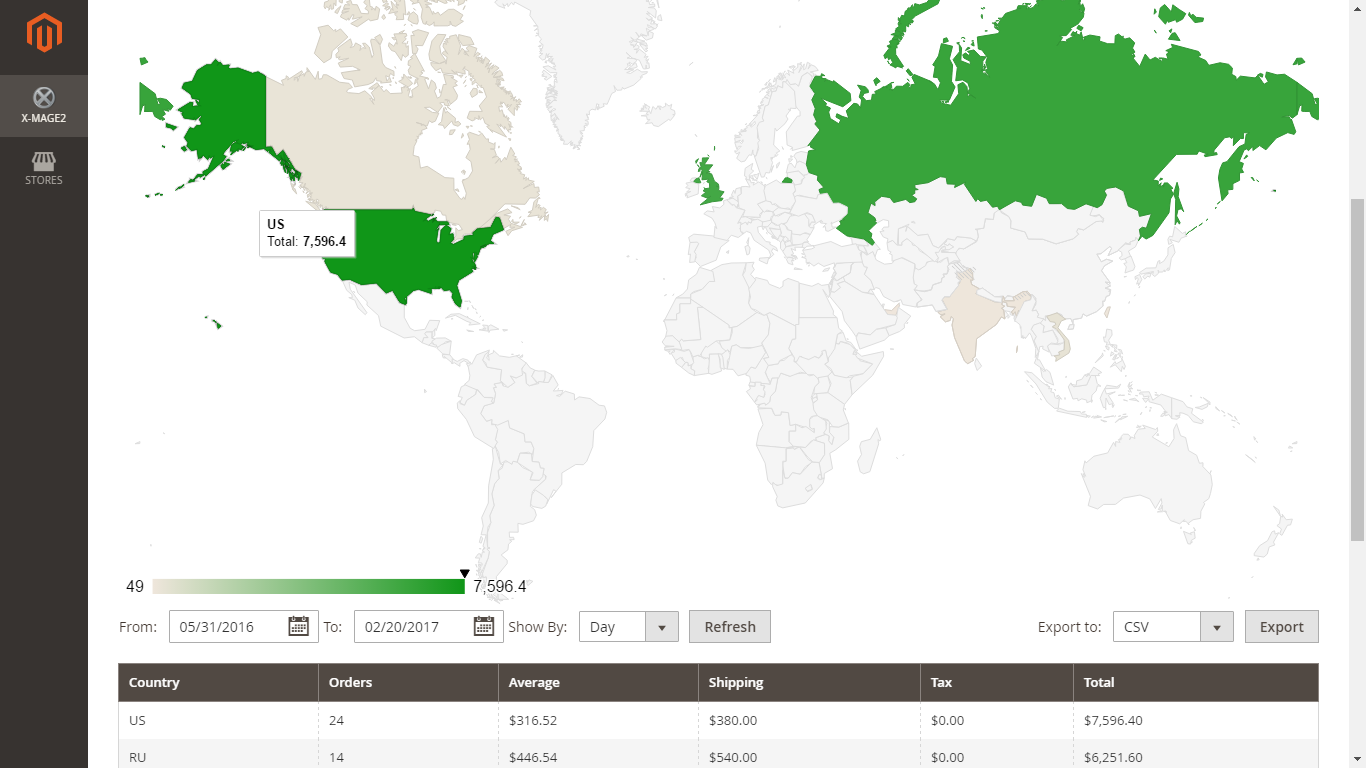
Geolocation Report:
Final data is calculated by statistic data and customer billing address. Based on billing address, geochart show location of customer and total based on that location. The geochart is customized from google geochart api. User can filter and view details of data in data table, geochart also update when table change.
-
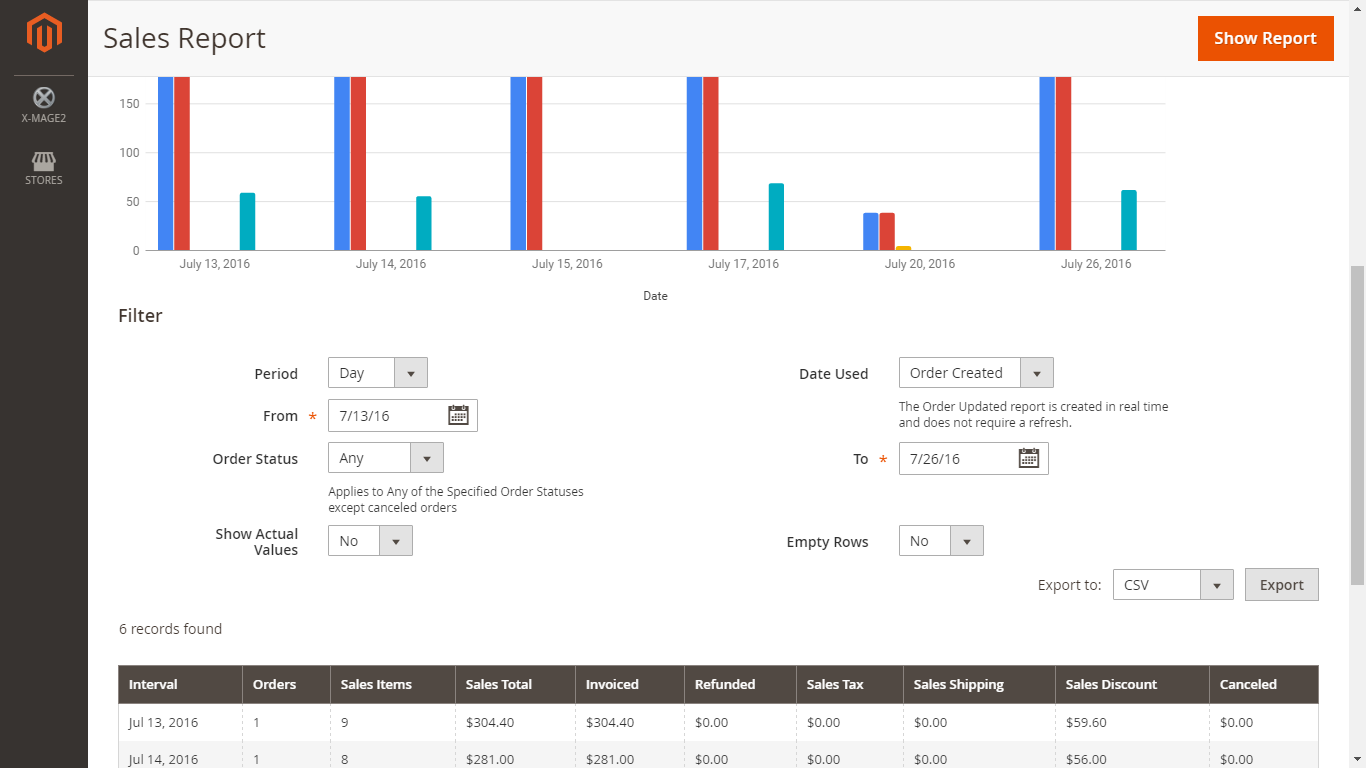
Sales Report:
Inherit basic sales orders report of magento, Advanced Reports provide multi-columns chart which show columns in table data, this chart type also allow user hide unneccessary data. The filter form also apply for this chart.
-
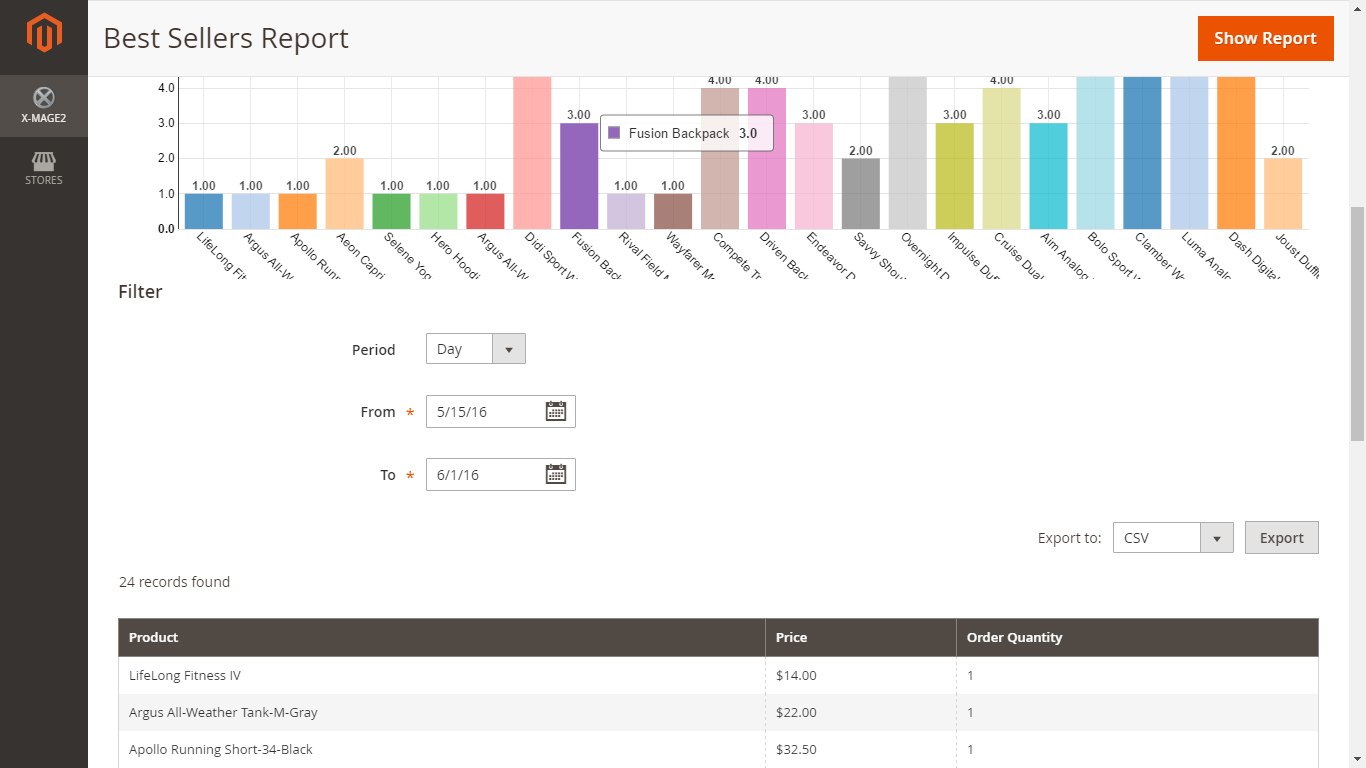
Bestseller Reports:
Show products and their sales data. This report based on basic bestseller reports of magento.
Change Setting:
Log into your Magento Admin, then goto Report -> Advanced Reports -> Configuration
Request Support
Feel free to get support via email: support@x-mage2.com
Change Log
Patch 08 (2019-07-13)
- Update source code for Magento 2.3.2
 ver. 2.1.2 (2017-02-20)
- Fix bug
- Change menu
 ver. 2.1.1 (2016-06-12)
- Fix bug: wrong date on weekly report (belong to revenue reports)
- Change default "from date" in bestseller, sales reports.
ver. 2.1.0 (2016-06-05)
* New features:
- User can view revenue report with selected date.
- Default chart data for: Sales report, Customer Group report, Geolocation report, Bestsellers report
ver. 2.0.1 (2016-05-12)
* Change javascript library from canvasjs to google chart library.
* Use nvd3 & google chart.
* Fix bugs:
- Wrong datetime format for revenue chart.
- Wrong geolocation data
ver. 1.0.0 (2016-05-10)
* initial realease
